이번에는 sklearn을 사용하지 않고 logistic regression을 모델링하고 차근차근 gradient descent, cost, weight등을 학습 할때마다의 변화를 그래프로 표현까지 해보는 예제를 포스팅 해보겠습니다. 역시나 logistic regression의 개념은 여러 위키 블로그, 서적등에 매우 잘 설명 되어있으므로 생략하겠습니다.
데이터 읽어와서 plot 그리기
import pandas as pd
import matplotlib.pyplot as plt
import numpy as np


df = pd.read_csv('logistic_regression_data.csv') # csv 파일 읽기


x= df.iloc[:, 1: -1].values # 입력값
y= df.iloc[: , -1].values #클래스

plt.scatter(x[:, 0][y == 0], x[:, 1][y == 0], marker='o',color='red', label='0') # 플랏 뿌려주기
plt.scatter(x[:, 0][y == 1], x[:, 1][y == 1], marker='x',color='blue', label='1')
plt.legend(["class 0", "class 1"], loc=4)
plt.grid(True)
plt.xlabel("x")
plt.ylabel("y")

plt.title("1")
plt.show()
데이터를 읽어와서 plt.scatter로 입력데이터 2개를 라벨 0,1로 나누어 그린 그래프입니다. 2차원 평면으로 표시했고 maker와 color등은 보기편하시게 고르시면 됩니다.
logistic regression 구성
sigmoid
def sigmoid(z):
    return 1 / (1 + np.exp(-z))
gradient descent
def grad(w, X, Y):
    y_pred = hx(w,X)
    g = [0]*3
    g[0] = -1 * sum(Y*(1-y_pred) - (1-Y)*y_pred)
    g[1] = -1 * sum(Y*(1-y_pred)*X[:,0] - (1-Y)*y_pred*X[:,0])
    g[2] = -1 * sum(Y*(1-y_pred)*X[:,1] - (1-Y)*y_pred*X[:,1])
    return g


def descent(w_new, w_prev, lr,iter ,w_plot=False,c_plot=False):
    #print(w_prev)
    w_new_R = []
    cost_R = []
    for i in range(0,iter):
        w_prev = w_new
        w0 = w_prev[0] - lr * grad(w_prev, x, y)[0]
        w1 = w_prev[1] - lr * grad(w_prev, x, y)[1]
        w2 = w_prev[2] - lr * grad(w_prev, x, y)[2]
        w_new = [w0, w1, w2]
        cost_R.append(cost(w_new, x, y))
        w_new_R.append(w_new)
        #print(w_new)
cost
def cost(w, X, Y):
    y_pred = hx(w,X)
    return -1 * sum(Y*np.log(y_pred) + (1-Y)*np.log(1-y_pred))
epoch에 따른 cost, weight 변화 그래프 표시
cost 그래프
epoch에 따른 손실률을 나타내는 그래프입니다. 점차 줄어들며 마지막에는 더이상 내려가지 않는 모습을 보입니다. 학습이 잘되고 있다는걸 눈으로 확인할 수 있습니다.
def plot_cost(alpha, epoch):

    w = [1, 1, 1]

    cost = descent(w, w, alpha, epoch,w_plot=False,c_plot=True)

    iter_num = range(len(cost))

    plt.scatter(iter_num, cost, label='cost')

    plt.xlabel("Iterations"); plt.ylabel("cost")
    plt.legend()

    plt.title("HW2")
    plt.show()


epoch = 100
alpha_lst = 0.001 #학습 rate

plot_cost(alpha_lst,epoch)
weight 그래프
epoch당 가중치의 변화값을 표현하는 그래프입니다. 모든 학습과정을 완료 한뒤 최적의 매개변수 가중치를 가지고 정확도를 판단합니다.
def plot_weight(alpha, epoch):

    w = [1, 1, 1]

    w = descent(w, w, alpha, epoch,w_plot=True,c_plot=False)

    iter_num = range(len(w))
    new_weight1= []
    new_weight2 = []
    new_weight3 = []
    for i in range(0,len(w)):
        new_weight1.append(w[i][0])
        new_weight2.append(w[i][1])
        new_weight3.append(w[i][2])

    plt.scatter(iter_num, new_weight1, label='w1')
    plt.scatter(iter_num, new_weight2, label='w2')
    plt.scatter(iter_num, new_weight3, label='w3')


    plt.xlabel("Iterations"); plt.ylabel("weight Value")
    plt.legend()

    plt.title("HW3")
    plt.show()

epoch = 100
alpha_lst = 0.001 #학습 rate
plot_weight(alpha_lst,epoch)

logistic regression 결정 경계선 그래프 그리기
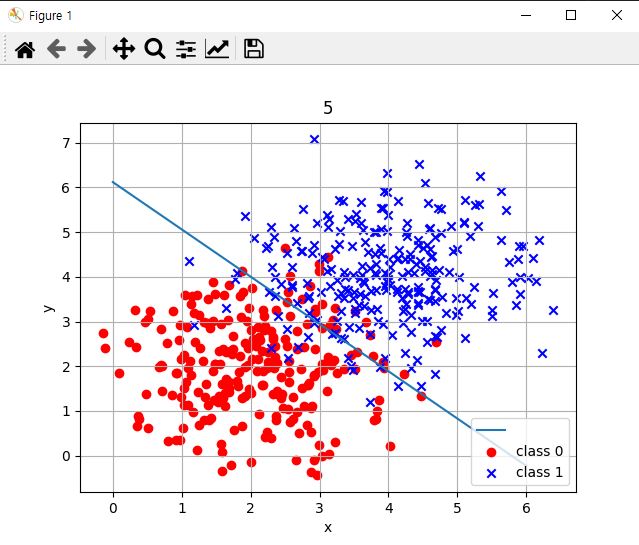
학습된 가중치를 가지고 마지막으로 logistic regression 결정 경계선을 그릴 차례입니다. 입력데이터가 2개 출력은 1개이므로 가중치는 총 3개 w0,w1,w2가 되겠습니다.
def graph(form, x_range):
    x = np.array(x_range)
    y = form(x)

    plt.plot(x, y)


def get_form(x):
    return (-result_w[0] - result_w[1] * x) / result_w[2]

graph(get_form, range(0,7))

plt.scatter(x[:, 0][y == 0], x[:, 1][y == 0], marker='o',color='red', label='0')
plt.scatter(x[:, 0][y == 1], x[:, 1][y == 1], marker='x',color='blue', label='1')

plt.legend(["", "class 0","class 1"], loc=4)
plt.grid(True)

plt.xlabel("x")
plt.ylabel("y")

plt.title("5")
plt.show()
모델 정확도 계산
def accuracy_score(y_true, y_pred):
    count = 0
    y_pred = y_pred>0.5
    for true, pred in zip(y_true, y_pred):
        if true == pred:
            count += 1
    return count/len(y_true)*100

y_pred=hx(result_w,x)


print("정확도 : "  +str(accuracy_score(y,y_pred)) + '%' )
이상으로 sklearn 없이 logistic regression을 구현하고 여러 그래프를 그리며 배운 이론대로 잘 그려지는지 확인 용도로 logistic regression 예제코드로 사용하시면 될것 같습니다.
'개발' 카테고리의 다른 글
| Keras Conv2d CNN 간단한 예제 ( Mnist data) (0) | 2022.05.24 |
|---|---|
| 파이썬 opencv 이미지 색상 추출 히스토그램 RGB 그래프 그리기 예제(colorHistogram, color 그래프 ) (0) | 2022.05.23 |
| (ETL) TALEND OPEN STUDIO DB 데이터 엑셀로 출력하기(MSSQL) (0) | 2022.05.18 |
| sklearn 사이킷런 SVM모델 그래프 그리기 (margin, decision boundary) (0) | 2022.05.16 |
| (ETL) TALEND OPEN STUDIO를 설치해보자. (0) | 2022.05.12 |


댓글